Safety & RESILIENCE INDICATOR
The Safety and Resilience Indicator (SRI) is a leading indicator (as opposed to a lagging indicator) that aims to operationalise safety and resilience by using a scale that moves away from zero (instead of towards). The SRI provides a score between 0-100 (or 0%-100%), with 0 reflecting the worst performance, and 100 the best performance.
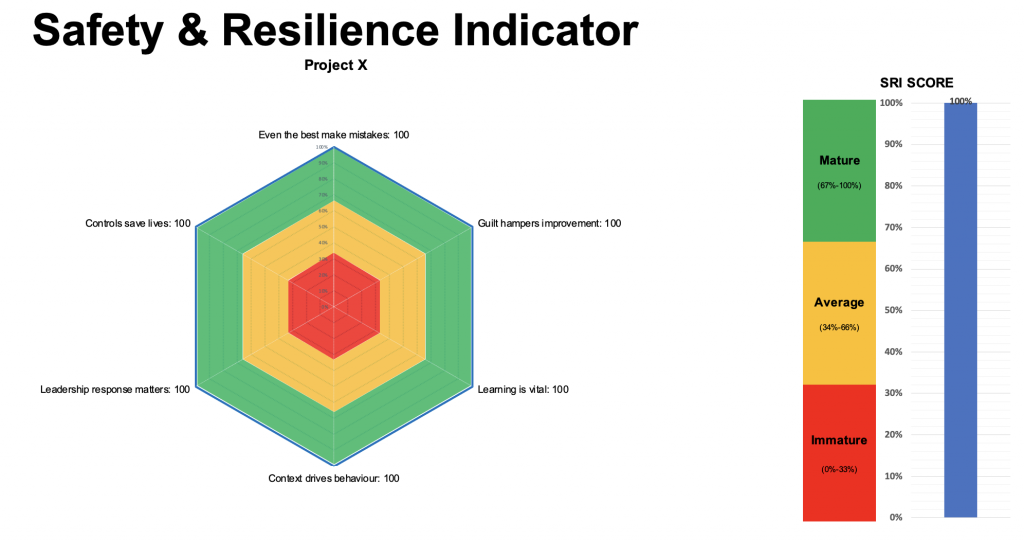
The SRI takes into account a range of data recorded during the time period of interest, including incidents and near miss events, critical control verifications, actions, as well as the results from a survey given to the staff and contractors involved in the work activities. The survey consists of 10 questions that inform the ‘Our Community Index’ (OCI) and ‘Psychological Safety Index’ (PSI). The SRI can be calculated for any point in time, or a time period of interest. Examples are for a maintenance outage, a financial year, or as per a particular date. The results are shown in a hexagon graph, outlining the overall SRI score and the scores for each principle. Below are the explanations of how the SRI (Version 1 “Wallaby”) operationalises each of the six HOP principles and calculates the SRI (Version 1 “Wallaby”). The data can be entered directly into the spreadsheet to calculate the SRI.
Operationalisation of 'Even the best make mistakes'
The SRI measures the ‘Event the best make mistakes’ principle by asking two survey questions. SRI elements 1.1 results from the ‘Our Community Index’ (OCI) survey, whereas element 1.2 from the ‘Psychological Safety Index’ (PSI).
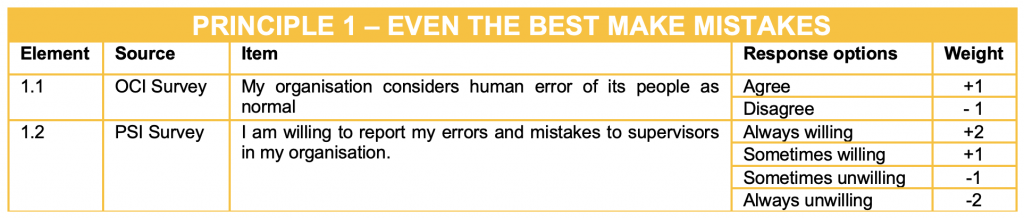
SRI Element 1.1 identifies whether people in the organisation consider human error as normal. Organisations are more resilient and able to prevent harm when they assume that even the best can make mistakes, and controls are put controls in place that prevent actions by individuals to result in harm (single point failures). In contrast, organisations that rely on people to always work flawlessly are poorly designed and have limited resilience.
SRI Element 1.2 provides insight into whether people are willing to report errors and mistakes. The more willing and inclined staff is to report errors and mistakes, the more the organisation can learn and improve and implement adequate controls.
Operationalisation of 'Guilt hampers improvement efforts'
The SRI measures the principle ‘Guilt hampers improvement efforts’ by reviewing event data and input from the OCI survey.
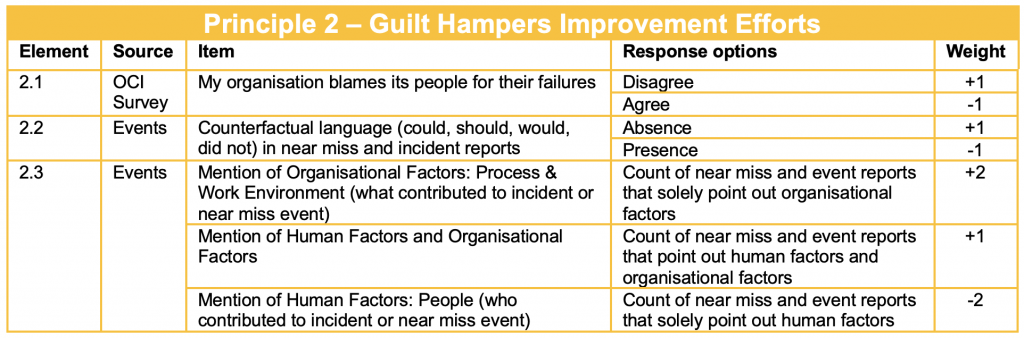
SRI Element 2.1 identifies whether staff believe that the organisation blames its people for their failures. This question is negatively geared: the more staff disagree, the higher the score.
SRI Element 2.2 reviews incident and near miss reports for counterfactual language to get a sense of the presence of allocating blame in event reporting. Counterfactual language points out what was omitted, what could or should have been done, and what would have prevented an event. Counterfactual language indicates judgment about people’s actions or inaction at the time.
SRI Element 2.3 considers whether incidents and near miss reports predominantly focus on human factors vs. organisational factors. Implementing solutions to human factors and considering organisational factors contributes to preventing the reoccurrence of similar events.
Operationalisation of 'Learning is vital'
The SRI measures the principle ‘Learning is vital’ by reviewing event data and input from the OCI survey.
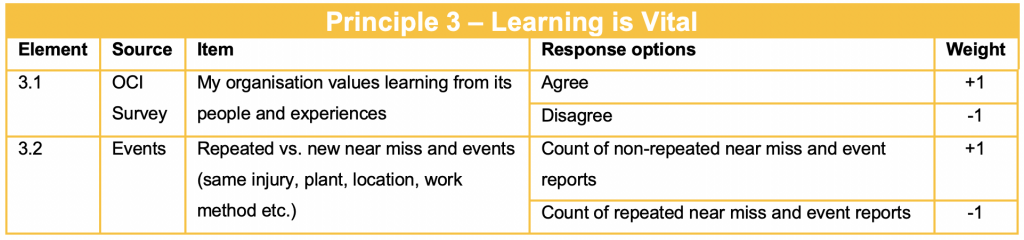
SRI Element 3.1 identifies whether the organisation values learning from its people and their experiences to continuously improve. The more the survey respondents agree to this question, the higher the score.
Learning is hampered when events occur that resemble each other, such as happening at the same location, involving the same Hazard Identification Risk Assessment (HIRA) or Safe Work Method Statement (SWMS), result in the same type of injuries, or involving the same plant. SRI Element 3.2 identifies repetition in incidents and near miss events as an indication for the presence or absence of learning.
Operationalisation of 'Context drives behaviour'
The SRI measures the principle ‘Context drives behaviour’ by reviewing event data and input from the OCI and PSI surveys.
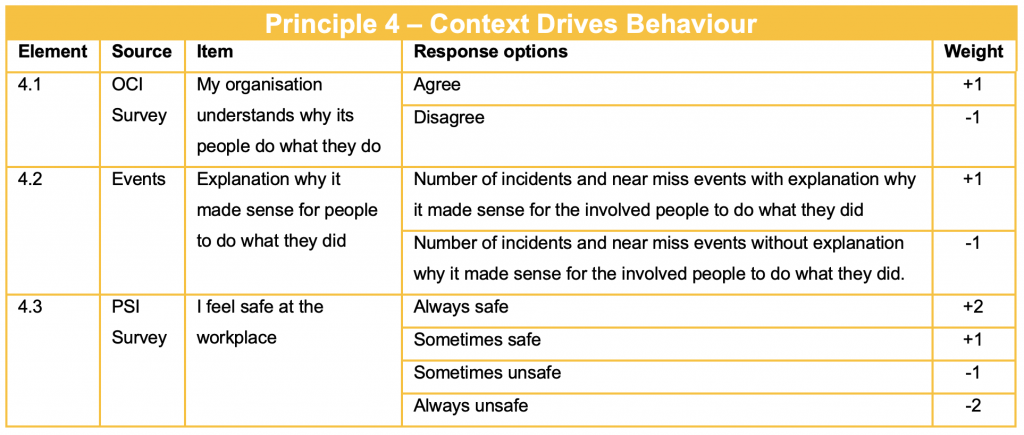
SRI Element 4.1 measures if the leaders in the organisation understand why people do what they do. Being informed about people’s reasoning helps identify work practices and trends and implement suitable controls when necessary.
SRI Element 4.2 queries whether near miss and incident reports provide explanations for actions by those involved in an event. The score increases with the count of incidents and near miss event reports that include explanations for the reasons of people’s actions.
SRI Element 4.3 captures the degree of people feeling safe at the workplace. The score increases with the number of responses of people indicating they feel safe.
Operationalisation of 'Leadership response matters'
The SRI measures the ‘Leadership response matters’ through the PSI and OCI surveys.
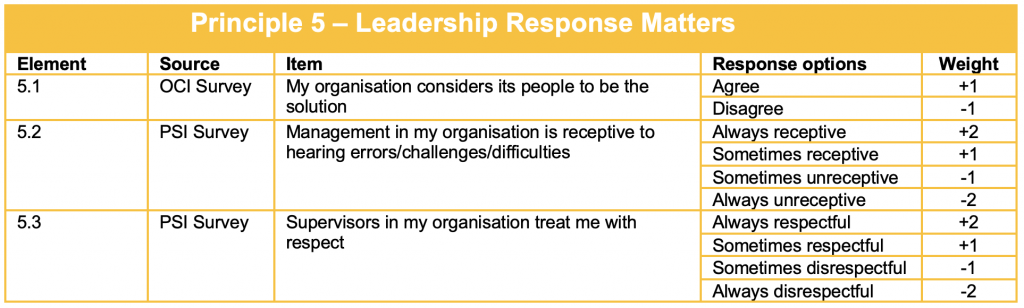
SRI Element 5.1 identifies if people are considered a solution or a problem. The term ‘people’ is used to reflect that this includes employees as well as contractors. The score increases as the number of people agree that the organisation considers people to be a solution to harness.
Leaders play a pivotal role in responding to critical information. Management needs to be receptive to hearing about what is going well and can be improved. SRI Element 5.2 captures if leaders are receptive to hearing about safety challenges, errors and difficulties that people experience at work. The score increases as the number of respondents indicate that leaders are receptive to hearing respective negative information.
SRI Element 5.3 identifies whether people feel respected. Disclosure of critical information is more likely when people feel respected.
Operationalisation of 'Controls save lives'
The SRI measures the principle ‘Controls save lives’ by reviewing events, critical control verifications, and input from the OCI survey.
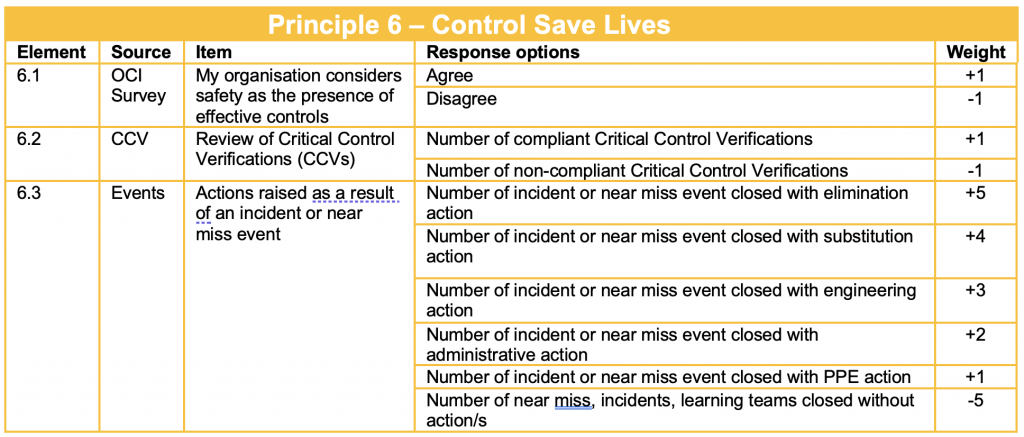
SRI Element 6.1 captures whether people in the organisation consider safety to be the presence of effective controls. The score increases as the number of people agree that safety is the presence of effective control.
SRI Element 6.2 reviews the number of compliant and non-compliant Critical Control Verifications (CCV). CCV inspections target safety-critical work activities that require compliance with strict work methods to be executed safety. The score increases as the number of CCVs that identify that the necessary controls are in place.
SRI Element 6.3 identifies if incident and near miss events have resulted in improvement actions. The score is negative when no action was allocated to a near miss or incident (-5). The weight of actions increases in accordance with the Hierarchy of Controls, with a PPE control being weighed the lowest (+1) whereas an elimination control the highest (+5).
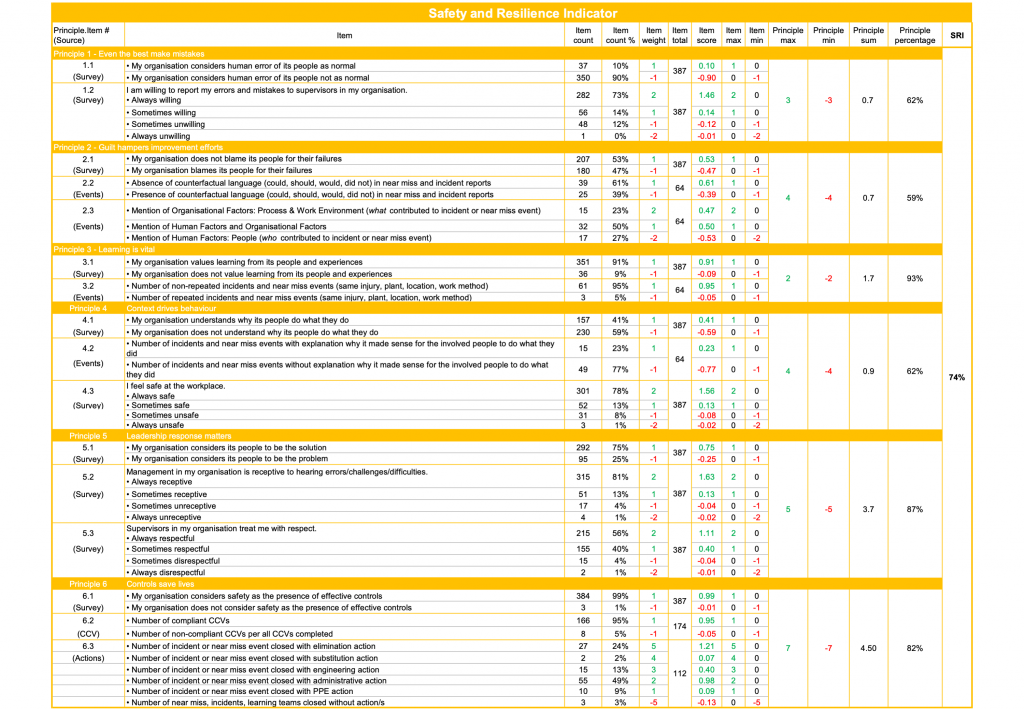
Calculation of the SRI
The SRI is calculated as follows (the below data is based on mock data):
- Each of the six Principle has a number of Elements, such as 1.1, 1.2. Each Element has Items, such as response options in the survey, e.g. ‘My organisation understands why its people do what they do.’
- The first step is to count the number of times an item occurred, which is the ‘Item count’ (as a number and a percentage) Examples are the number of times survey respondents selected a particular response option, the number of repeated events, the number of compliant CCVs, or the number of actions closed with engineering controls.
- Each item is given a weight factor so the positive and negative responses balance out to 0. The factor is 1x for binary response options, e.g. agree (+1) vs. disagree (-1). The weight can be greater than 1 for items with multiple response options, e.g. sometimes willing to… (+1); always willing… (+2).
- The second step is to calculate the ‘Item total,’ which is the sum of the ‘Item count’ per Element. An example is the total number of responses to a survey question.
- The third step is to calculate the ‘Item score’, which is the ‘Item count’ times the ‘Item weight’ divided by the ‘Item score.’ Depending on the sign of the weight factor, the ‘Item score’ is positive, negative, or 0.
- The ‘Item max’ and ‘Item min’ are the maximum and minimum values the respective ‘Item score’ can adopt.
- The ‘Principle max’ is the sum of the ‘Item max’ per principle. The ‘Principle min’ is the sum of the ‘Item min’ per principle.
- The fourth step is to calculate the ‘Principle sum,’ which is the sum of the ‘Item scores’ per principle.
- The fifth step is to translate the ‘Principle sum’ score into the ‘Principle percentage’ score, using a conversion table. This step translates the sum value into a percentage value. The ‘Principle percentage’ scale ranges from 0-100%. The ‘Principle min’ value represents 0%; 0 represents 50%; and the ‘Principle max’ value represents 100%. For instance, if the ‘Principle max’ is +4 and the ‘Principle min’ value is -4, the score -4 represents 0%; the score 0 represents 50%; and the score +4 represents 100%.
- The sixth step is to calculate the SRI score, which is the average of the six ‘Principle percentage’ values.
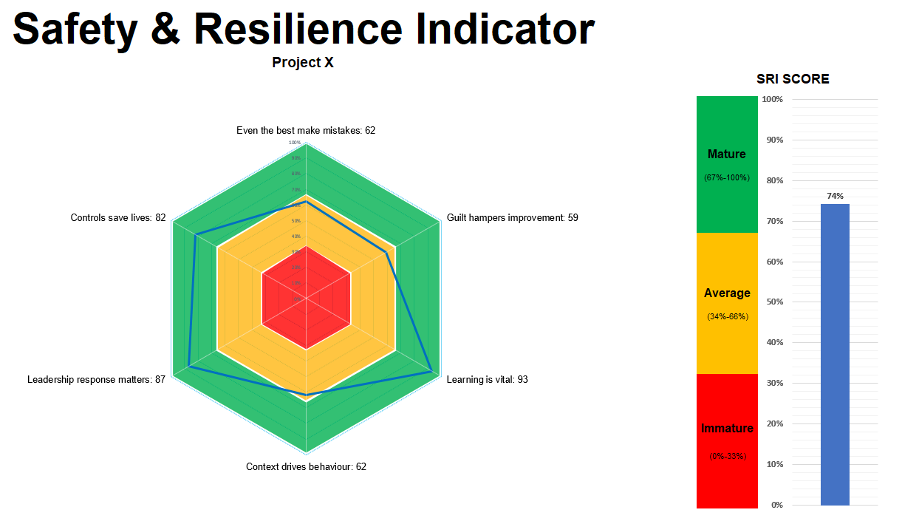
The SRI is depicted in a graph that shows the overall SRI score, such as for Project X, and the score for each principle.
Interpretation of findings
In this example, the organisation achieved a mature SRI of 74%. The highest score was 93% (learning), whereas none of the principle received a score lower than 59%.
Learning is vital: The organisation has a strong focus on learning (93%). The review of events indicates that incidents and near miss events are hardly repeated (3.2). The majority of survey respondents agree that the organisation values learning from its people and their experiences (3.1).
Leadership response matters: The response matters score was equally high (87%). Many survey respondents indicate that that the organisation regards people as a solution (5.1). Leaders are mostly receptive to hearing about challenges (5.2). Most people feel always treated respectfully (5.3).
Controls safe lives: Controls are considered in place and effective (82%). The majority of CCVs identified that controls are in place (6.2). The organisation largely relies on administrative controls. It has adopted elimination and engineering controls to reduce hazards and risks (6.3). Only a small number of events were closed out without a corrective action.
Event the best make mistakes: The organisation hardly considers human error as a normal by-product of people conducting work (1.1). Some staff are willing to report errors and mistakes to supervisors, but a relatively large number is reluctant to do so (1.2).
Guilt hampers improvement: The organisation has progressed towards taking both human and organisational factors into account in event investigations (2.3). There is almost an equal number of staff indicating that the organisation blames people for their failures versus not (2.1). Many event reports contain counterfactual language about outlining what people could or should have done but did not do (2.2).
Context drives behaviour: People working in the organisation mostly feel safe (4.3). However, incident and near miss event reports lack explanations of the reasoning behind people’s behaviour (4.2). The organisation needs to better understand why people do what they do and the context in which work takes place (4.1).